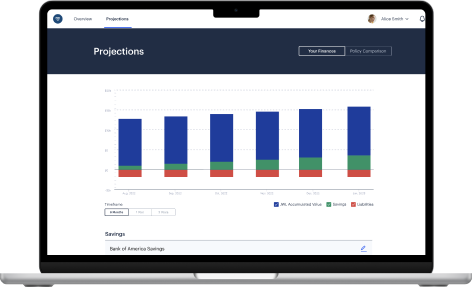
Eric completed Projections tool. Marissa completed Overview and Policy Details.
Feedback
Usability Testing
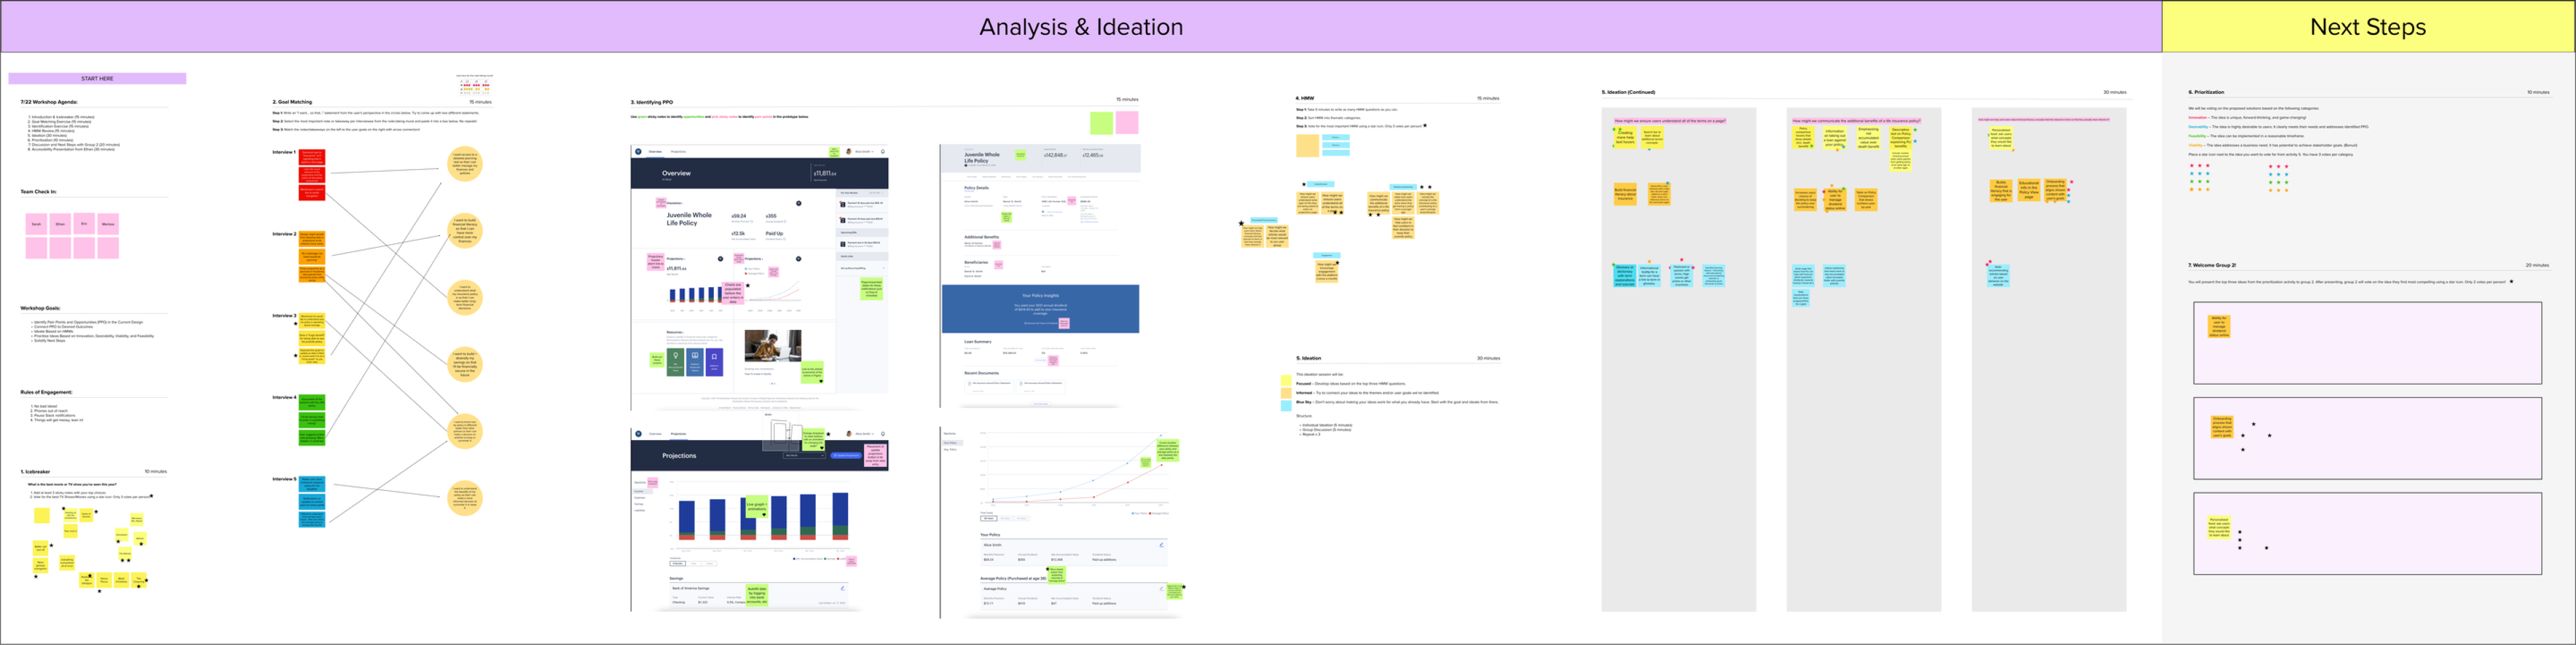
Post Feedback - Analysis and Ideation
Usability Testing
Completed by Sarah with rest of team observing
Process
5 Participants
Ranged in age from 30-50
Owned their Juvenile Policy or had a policy taken out on their behalf
Asked questions as they were walked through the prototype
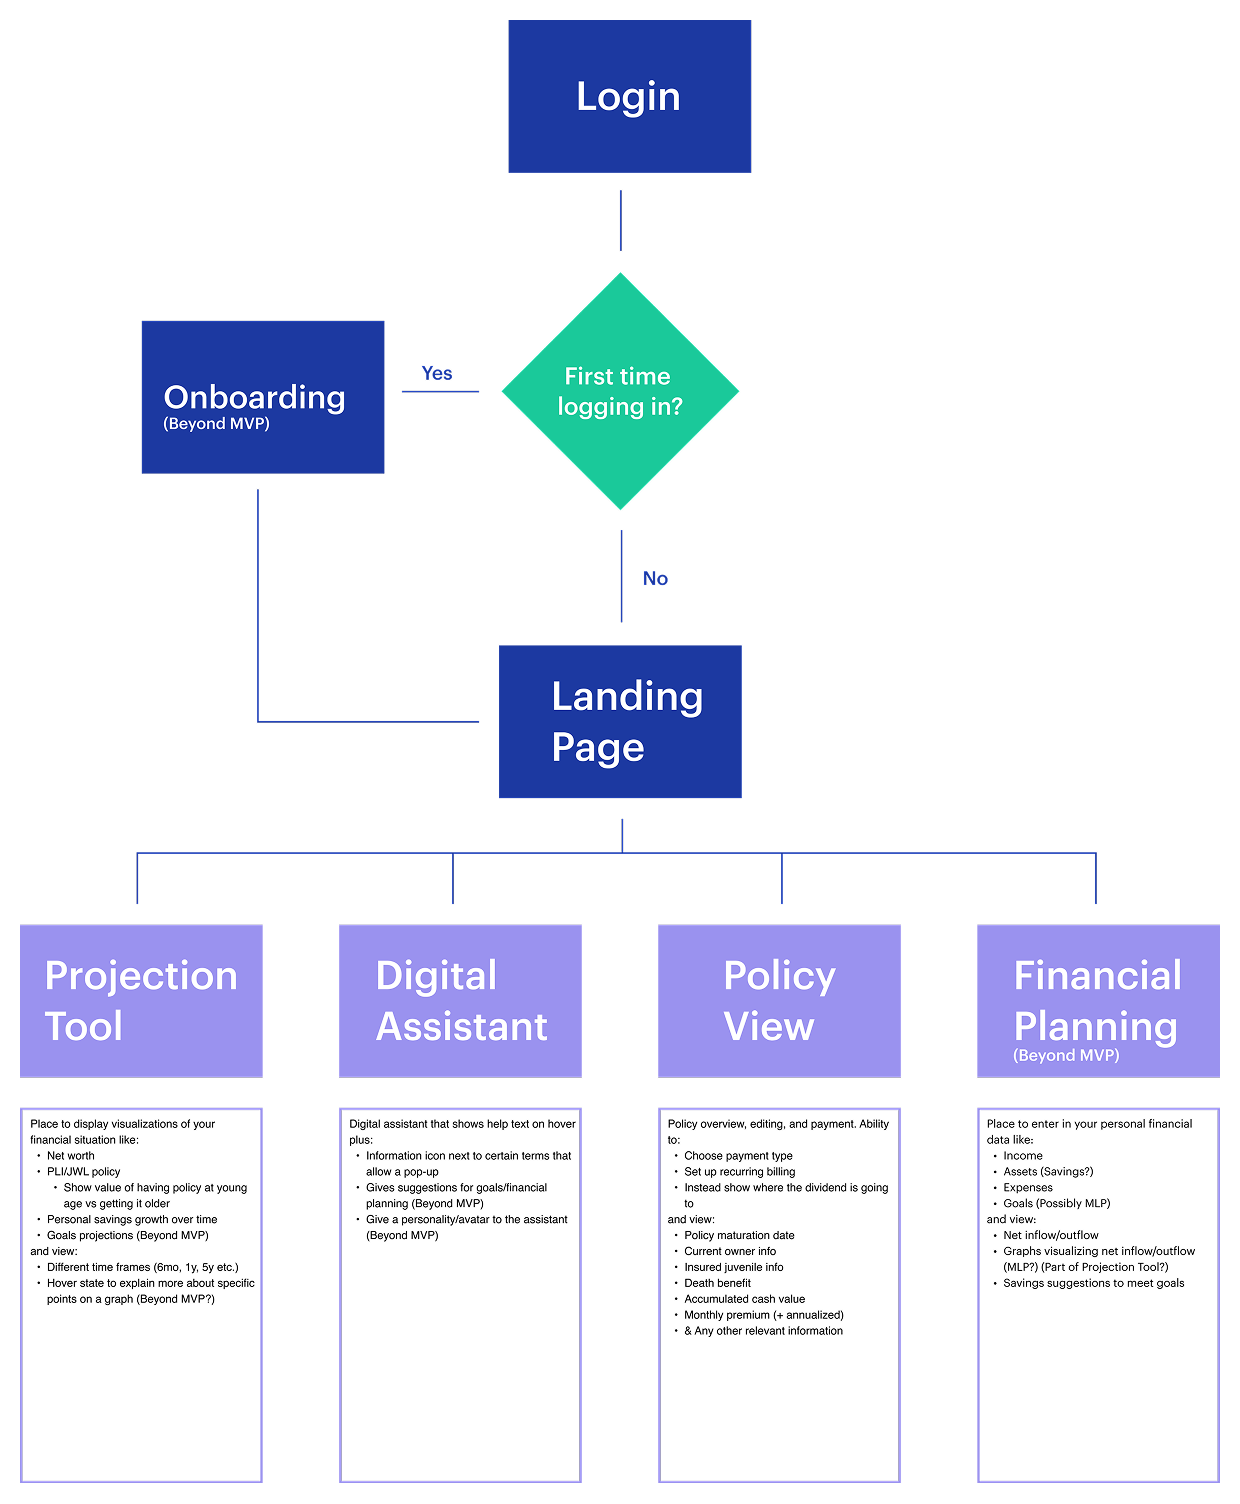
User Flow Diagram
Completed as a team
Here is the document where we combined notes from the feedback interviews, made notes to specific screens where we needed to make changes, and began ideating on additions we wanted to make to our prototype.
Phase 2 Design
Changes Made
Updated User Flow Diagram
Finalized Prototype
Changes Made
Fixed
Typos (Ethan)
Minor layout edits to overview screen (Marissa)
Fixes to policy details screen (Marissa)
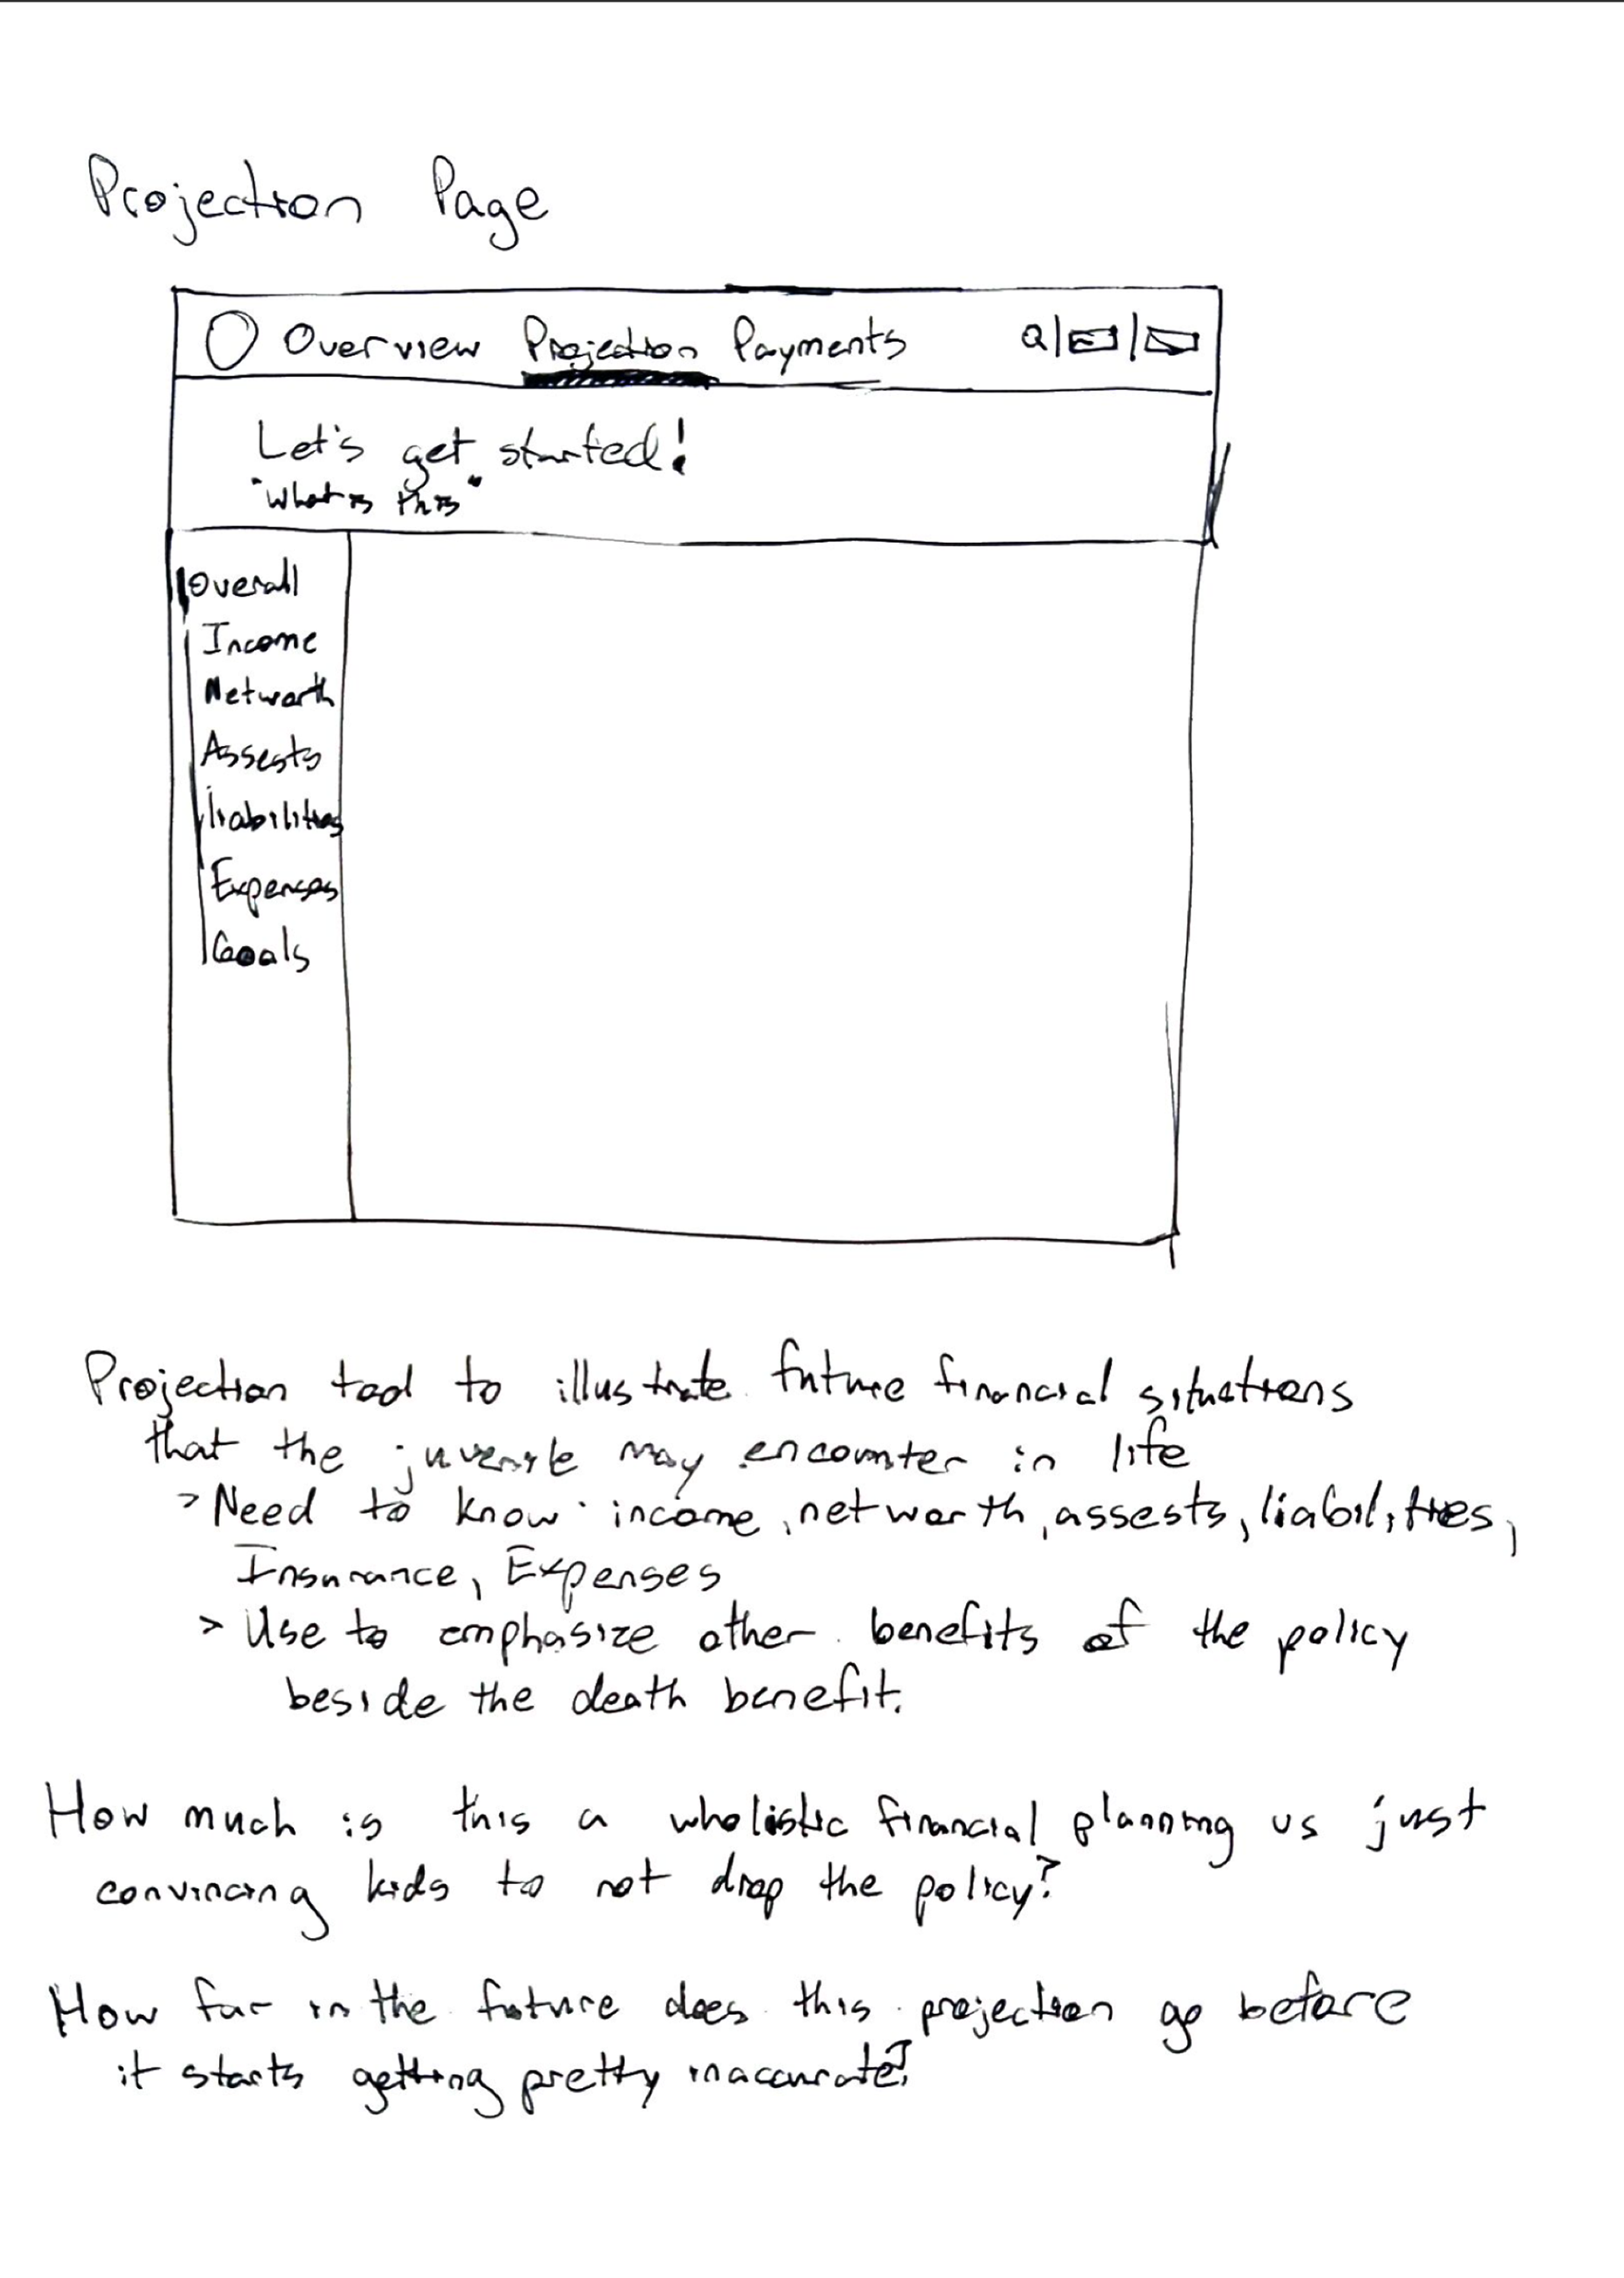
Adjusted projections tool to be a live graph (Eric)
Added
Onboarding process (Ethan)
Tooltips to explain technical language to users (Ethan)
Resources pages: personalized feed with articles on finances (Marissa)
Policy Comparison graph that shows the value of the user’s policy along side a policy purchased at age 30 (Eric)
Updated User Flow Diagram
Completed as a team
Finalized Prototype
Reflection
Potential Outcomes
Increase retention of juvenile policy accounts
Assists in young adults sense of financial literacy